- Bearish scenario: Sell below 5240.14 with TP1: 5221.23 and only after its breakout, TP2: 5203.75 with S.L. above 5241 or at least 1% of account capital.
Bullish scenario after retracement: Buy above 5203.75 (wait for bullish reversal pattern formation) with TP: 5241, TP2: 5261, and TP3: 5278 with S.L. below 5187 or at least 1% of account capital. Apply trailing stop.
Fundamental Analysis:
Recent US jobless claims data growing by 231 thousand, the highest level in six months, confirm a weak labour market outlook, following worse-than-estimated non-farm payroll data and higher unemployment, fueling expectations that the Fed might anticipate the first rate cut for September.
Any expectation of rate cuts benefits index sentiment as it alleviates pressure on corporate financing and improves profit expectations.
Technical Analysis H4:
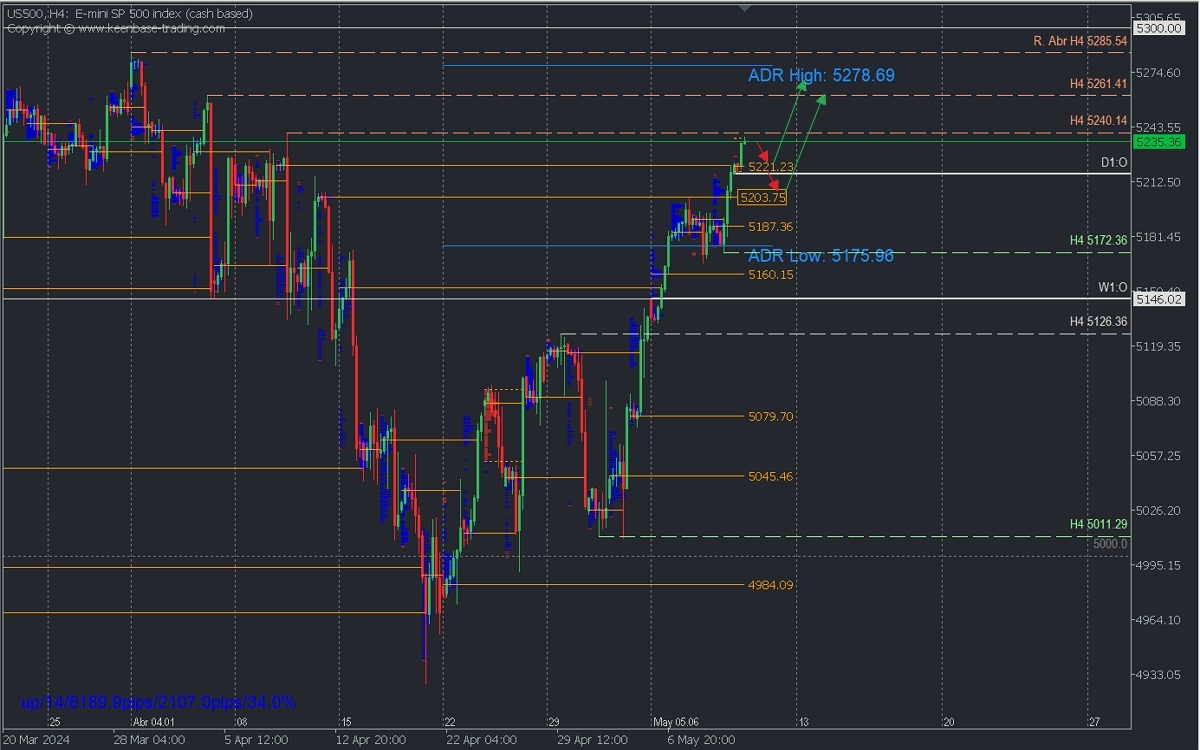
The strong breakout of April's early weeks' selling POC confirms index strength, further supported by USD weakness. A scenario we anticipate to continue short-term aiming to surpass 5300 for the next week.
After reaching resistance at 5240, a moderate intraday retracement towards the recently broken supply zone at 5221.23 can be expected, from where considering resuming buys, as long as quotations form an exhaustion and reversal pattern around 5221.
The intraday buying target is located at resistances 5261.41 and 5285.54. This bullish scenario can extend above 5241 if quotations show no exhaustion but instead leave small pauses, indicating rapid bullish continuation towards the intraday mentioned above targets.
If the price keeps dropping below 5221 without showing signs of exhaustion, it may be wise to consider selling towards the next demand zone around 5203.75 and 5187.36. However, this should only be done if the former is decisively broken or after a second bearish move.
These demand zones are expected to be defended by bulls to prompt the awaited renewed rally, as long as the last relevant support at 5172.36 is not broken, in which case, we'll have the first signal of bearish reversal.
*Uncovered POC: POC = Point of Control: It is the level or area where the highest volume concentration occurred. If there was a previous downward movement from it, it is considered a selling zone and forms a resistance area. Conversely, if there was a previous upward impulse, it is considered a buying zone, usually located at lows, thus forming support zones.
Risk Warning:
This analysis does not constitute investment advice or an offer to engage in financial transactions. Although all investments carry risks, trading forex and other leveraged assets can involve significant losses. A full understanding of the risks is recommended before investing.

