FBS turns 16

Unlock birthday rewards: from gadgets and dreams cars to VIP trips.Learn more
Open account
Open accountLog In
Open account

June 05, 2025

Strategy

How to Trade On a Shooting Star Pattern

How to Trade On a Shooting Star Pattern

One of the most popular and reliable methods of finding entry and exit signals is identifying candlestick and chart patterns. These patterns are a part of technical analysis, which uses historical market data to analyze how traders of the past behaved under similar market conditions. Since the psychology of traders hasn’t changed much over the years, there is a high chance that nowadays traders will act in the same way and confirm the pattern.

In this article, you will learn more about one of the most well-known patterns: the Shooting Star candlestick. We'll discuss the conditions behind its formation, how to identify it on a chart, and ways you can use it in your trading strategy.

What is a Shooting Star?

A Shooting Star is a potent bearish candlestick pattern generally occurring at the end of a prolonged uptrend and before a reversal to a downtrend.

This pattern consists of a single candlestick, but what’s unique about it is the body: a Shooting Star candle has a small real body near the day’s low. This happens because the price of an asset closes near its opening price, showing that the bulls hadn't managed to raise the price in the span of that day.

At the same time, the upper wick of a Shooting Star candle is really long, at least twice the length of its body. The lower wick is barely visible, sometimes even non-existent, so the most recognizable part of this pattern is its long upper wick.

What is a Shooting Star

What does a Shooting Star pattern mean?

A Shooting Star pattern usually occurs after a steady and prolonged uptrend, often after at least three consecutive bullish candles. It can also appear after a few bearish candlesticks, provided that the overall price movement has strong bullish tendencies.

The small body and the long wick of a Shooting Star indicate that the bulls dominating the market had tried to push the price even higher when the day started. But the higher price swiftly attracted more bears who, in turn, pulled the price back down almost to the opening level.

This pattern shows that bulls might be losing their grasp on the market and signifies a potential shift in market sentiment from bullish to bearish. The buying pressure gives in to the force of the selling pressure, giving traders a sign that the prevailing uptrend may weaken and potentially indicating an impending trend reversal or a significant pullback.

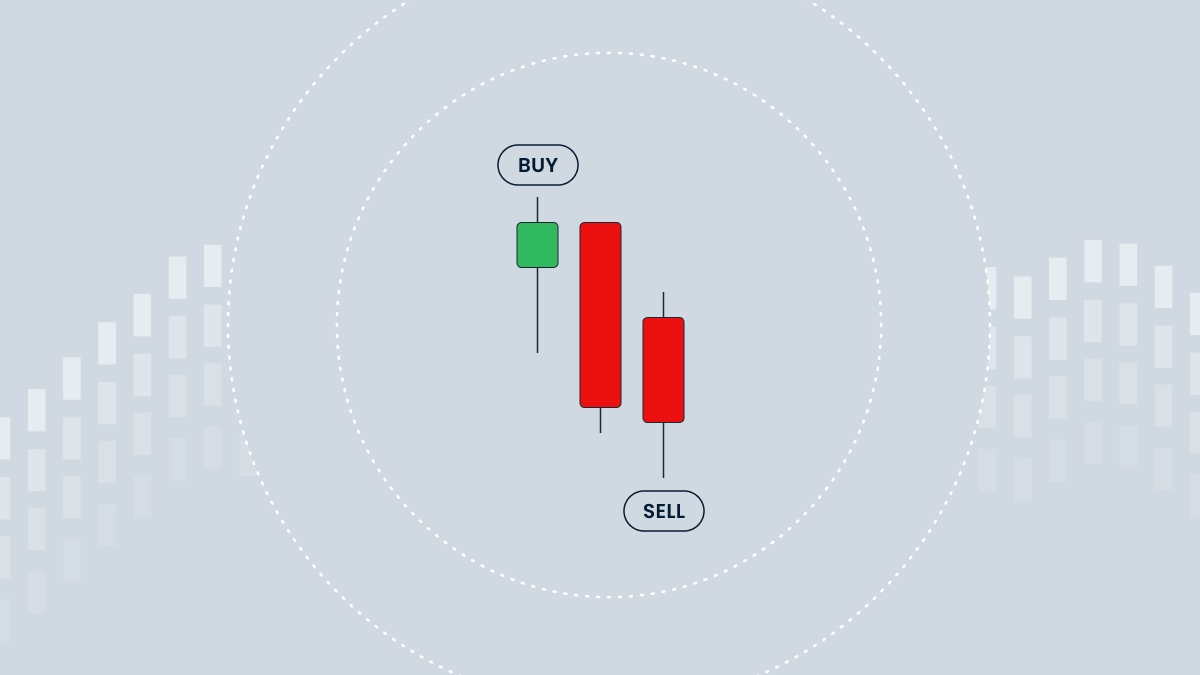
The pattern is considered confirmed if the following candlestick is bearish and closes lower. The upper wick of the successive candle should be shorter than the high of the Shooting Star. If it is, there is a very high chance that bears have managed to take over the market, so traders may attempt to use this opportunity to place sell orders.

How to trade a Shooting Star

To make the most of a Shooting Star pattern, consider the following steps:

  • Identify an uptrend. A Shooting Star is more reliable when it occurs during a prolonged uptrend. Even though the price never moves in a straight line, each consecutive peak and trough are higher than the previous ones. To identify an uptrend, look for a series of higher highs and higher lows that indicate a clear upward trajectory.

  • Look for a Shooting Star pattern. Scan the chart for a candlestick with a small body near the day's low, a long upper wick at least twice the length of the body, and a short lower wick.

  • Validate with additional indicators. To get a fuller picture on the possibilities of a reversal, make use of technical analysis indicators. With them, you can measure other parameters of the current price action, such as trend direction, trading volume, price momentum, support/resistance levels, etc. If other indicators give strong reversal signals, you have more reasons to believe that the Shooting Star pattern will lead to a change in the direction of price movement.

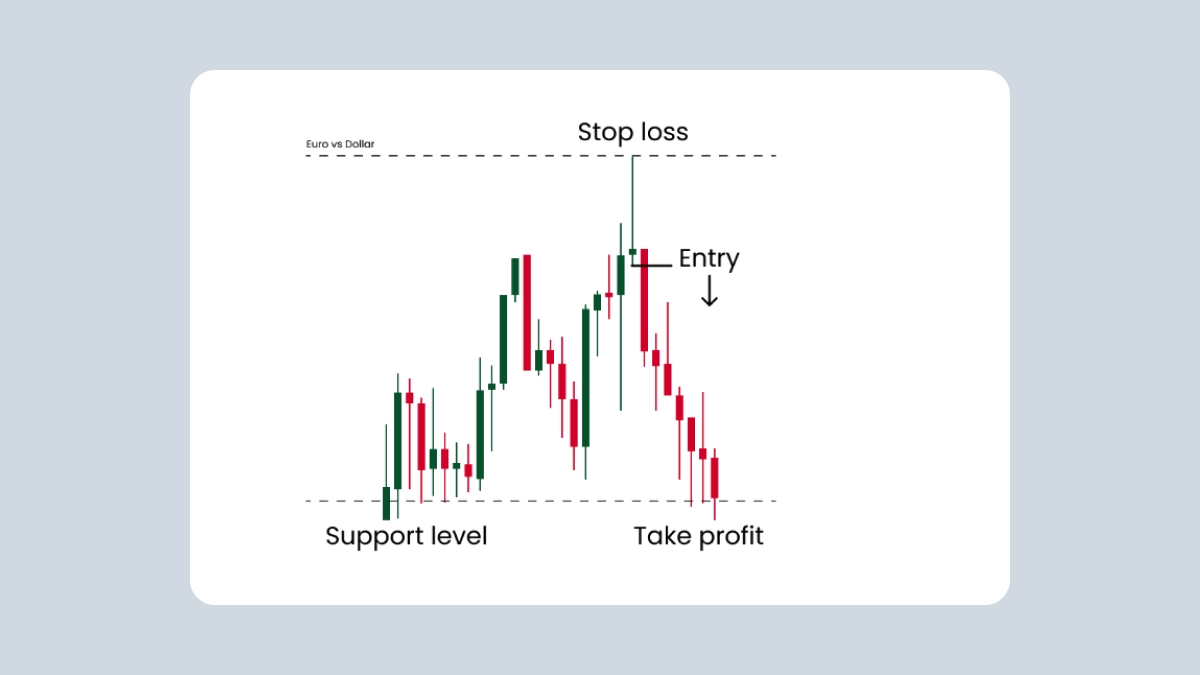
  • Plan your trade. Spotting any chart pattern gives you a unique opportunity to plan your entries and exits. Once a Shooting Star is confirmed, you may establish an entry point at the level a confirmation has occurred, set a stop-loss order above the upper wick to manage risk, and determine a profit target based on your trading strategy and risk-reward ratio.

Shooting Star: example

How to trade a Shooting Star

This chart shows that a Shooting Star with its short body and long upper wick appeared at the top of the third peak. It is closely followed by a bearish candlestick that closed much lower than the Shooting Star, indicating that the bears managed to overpower the bulls and reverse the trend completely. The entry point is placed below the lower wick of the Shooting Star, while the stop-loss is set above its upper wick. The take-profit order is placed at the previous support level in case the price bounces again.

Advantages and limitations of a Shooting Star pattern

Both retail and professional traders hold the Shooting Star pattern in high regard. Let's look at the most notable advantages of this pattern:

  • Easy to identify. Shooting stars include only one candlestick with a very distinct shape, making it easier to spot on the chart than most other patterns.

  • Reliability. Traders note that Shooting Star patterns are particularly useful and reliable when identifying potential trend reversals, especially if it occurs near the resistance level and all other necessary conditions are met.

  • Suitable for beginners. This pattern is fairly simple, so even beginners can spot and trade it.

  • Frequency. This pattern is one of the most frequent patterns appearing on the chart, so traders have many opportunities to find and use it to their advantage.

However, even Shooting Stars have certain limitations that traders need to take into account if they want to avoid common pitfalls. Here are the most common ones:

  • False signals. False signals can really spoil a potentially profitable trade. As with any trading pattern, a Shooting Star candlestick pattern can give off false signals, especially in volatile or choppy markets. Therefore, it is crucial to wait for the confirmation of the pattern or employ additional confirmation techniques to validate the pattern’s reliability before placing trade orders.

  • Confirmation through indicators. While a Shooting Star is considered a reliable pattern, it’s still important to use other means of analysis, like the technical analysis indicators mentioned above, to ensure the reversal signal isn't false.

  • Contextual analysis. The price of assets doesn’t move in a vacuum. Multiple factors affect it, so analyzing the current market conditions and context will help you get more information and prevent you from trading against the prevailing trend.

Shooting Star and Inverted Hammer: what is the difference?

A Shooting Star pattern is often mistaken for an Inverted Hammer pattern. Both are single-candlestick reversal patterns with a small body, longer upper wick, and extremely short or non-existent lower wick. Just like a Shooting Star, an Inverted Hammer indicates that the price has been pushed up by bulls but closed near the opening price because of selling pressure.

However, unlike a Shooting Star, an Inverted Hammer occurs at the end of a downtrend. In contrast to the bearish nature of a Shooting Star, an Inverted Hammer indicates that the bulls are finally getting stronger, and the trend might reverse to a bullish one.

To tell a Shooting Star and an Inverted Hammer apart, you need to identify the current trend. If it’s bullish, the candlestick in question is a Shooting Star. But if it's bearish, you're looking at an Inverted Hammer.

Summary

As you learned today, a Shooting Star pattern is an extremely valuable tool, offering valuable insights into market sentiment and potential price reversals. By applying the knowledge gained from understanding this pattern, traders can increase their chances of success in the ever-changing world of trading.

However, it is important to remember that no strategy is infallible, and continuous learning, adaptation, and integration of multiple analysis techniques are essential to thrive in the dynamic financial markets.

Share with friends:

Open an FBS account

By registering, you accept FBS Customer Agreement conditions and FBS Privacy Policy and assume all risks inherent with trading operations on the world financial markets.

FBS at social media

iconhover iconiconhover iconiconhover iconiconhover icon

Contact us

iconhover iconiconhover iconiconhover iconiconhover icon
store iconstore icon
Get on the
Google Play

Trading

Company

About FBS

Legal documents

Company news

FC Leicester City

Help Center

Partnership programs

The website is operated by FBS Markets Inc.; Registration No. 000001317; FBS Markets Inc. is registered by the Financial Services Commission under the Securities Industry Act 2021, license number 000102/31. Office Address: 9725, Fabers Road Extension, Unit 1, Belize City, Belize.

FBS Markets Inc. does not offer financial services to residents of certain jurisdictions, including, but not limited to: the USA, the EU, the UK, Israel, the Islamic Republic of Iran, Myanmar.

Payment transactions are managed by HDC Technologies Ltd.; Registration No. HE 370778; Legal address: Arch. Makariou III & Vyronos, P. Lordos Center, Block B, Office 203, Limassol, Cyprus. Additional address: Office 267, Irene Court, Corner Rigenas and 28th October street, Agia Triada, 3035, Limassol, Cyprus.

Contact number: +357 22 010970; additional number: +501 611 0594.

For cooperation, please contact us via [email protected].

Risk Warning: Before you start trading, you should completely understand the risks involved with the currency market and trading on margin, and you should be aware of your level of experience.

Any copying, reproduction, republication, as well as on the Internet resources of any materials from this website is possible only upon written permission.

The information on this website does not constitute investment advice, a recommendation, or a solicitation to engage in any investment activity.