Economic indicators tend to come in the form of regular, scheduled official releases by governments, non-profit organizations, and universities. In the US, most traders await reports by the US Bureau of Labor Statistics, which publishes data about the employment rate and inflation, the US Census Bureau, which reports on sales and housing data, the Federal Reserve, which sets interest rates, and the Conference Board, which researches and produces the Consumer Confidence Index.
Types of economic indicators
Economic indicators can fall under three main categories depending on their timing relative to the economic cycle.
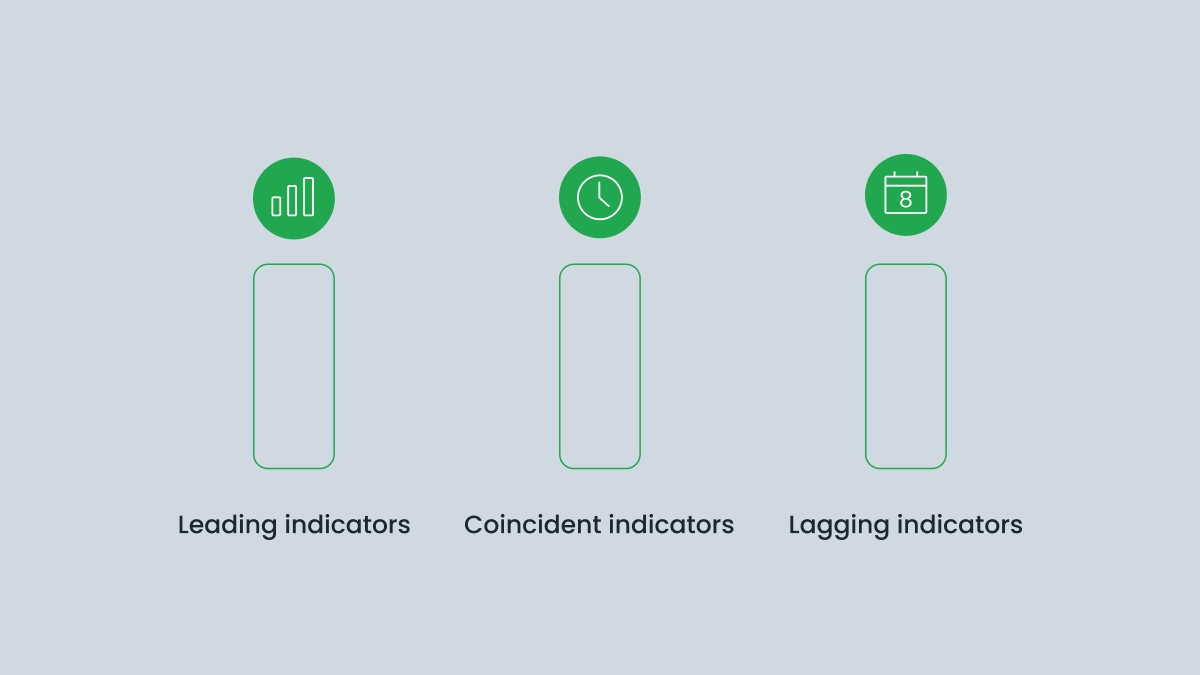
Leading indicators predict future changes and trends in the economy. These include the yield curve, share prices, and net business formations. They are called “leading” because the numbers will change before the economy does, which makes them helpful in making predictions.
Coincident indicators are like real-time snapshots of an economy’s health. They focus on a particular area or region. These include GDP and employment levels. They are the most closely followed by policymakers because they capture what is currently happening in the economy.
Lagging indicators, as their name suggests, provide data after economic events have already happened. These include the Consumer Price Index (CPI) and unemployment rates. Although they provide insight into the state of the economy, they aren’t very useful in developing strategy or finding trading opportunities because the figures may already be outdated by the time they are released.
Attributes of economic indicators
Economic indicators can be procyclical, countercyclical, or acyclical. These are complicated words, but they’re pretty straightforward.
Procyclical indicators move in the same direction as the economy. For example, a country’s GDP will follow the performance of its economy, increasing if it is thriving and decreasing if it is in a recession.
Countercyclical indicators move in the opposite direction from the economy. For example, the unemployment rate may tend to be lower if the economy is doing well.
Acyclical indicators are not related to the economy. For example, energy consumption and natural disasters are independent of the business cycle. The climate can, however, affect markets and economies in the long run through crop production.
What are the key economic indicators?
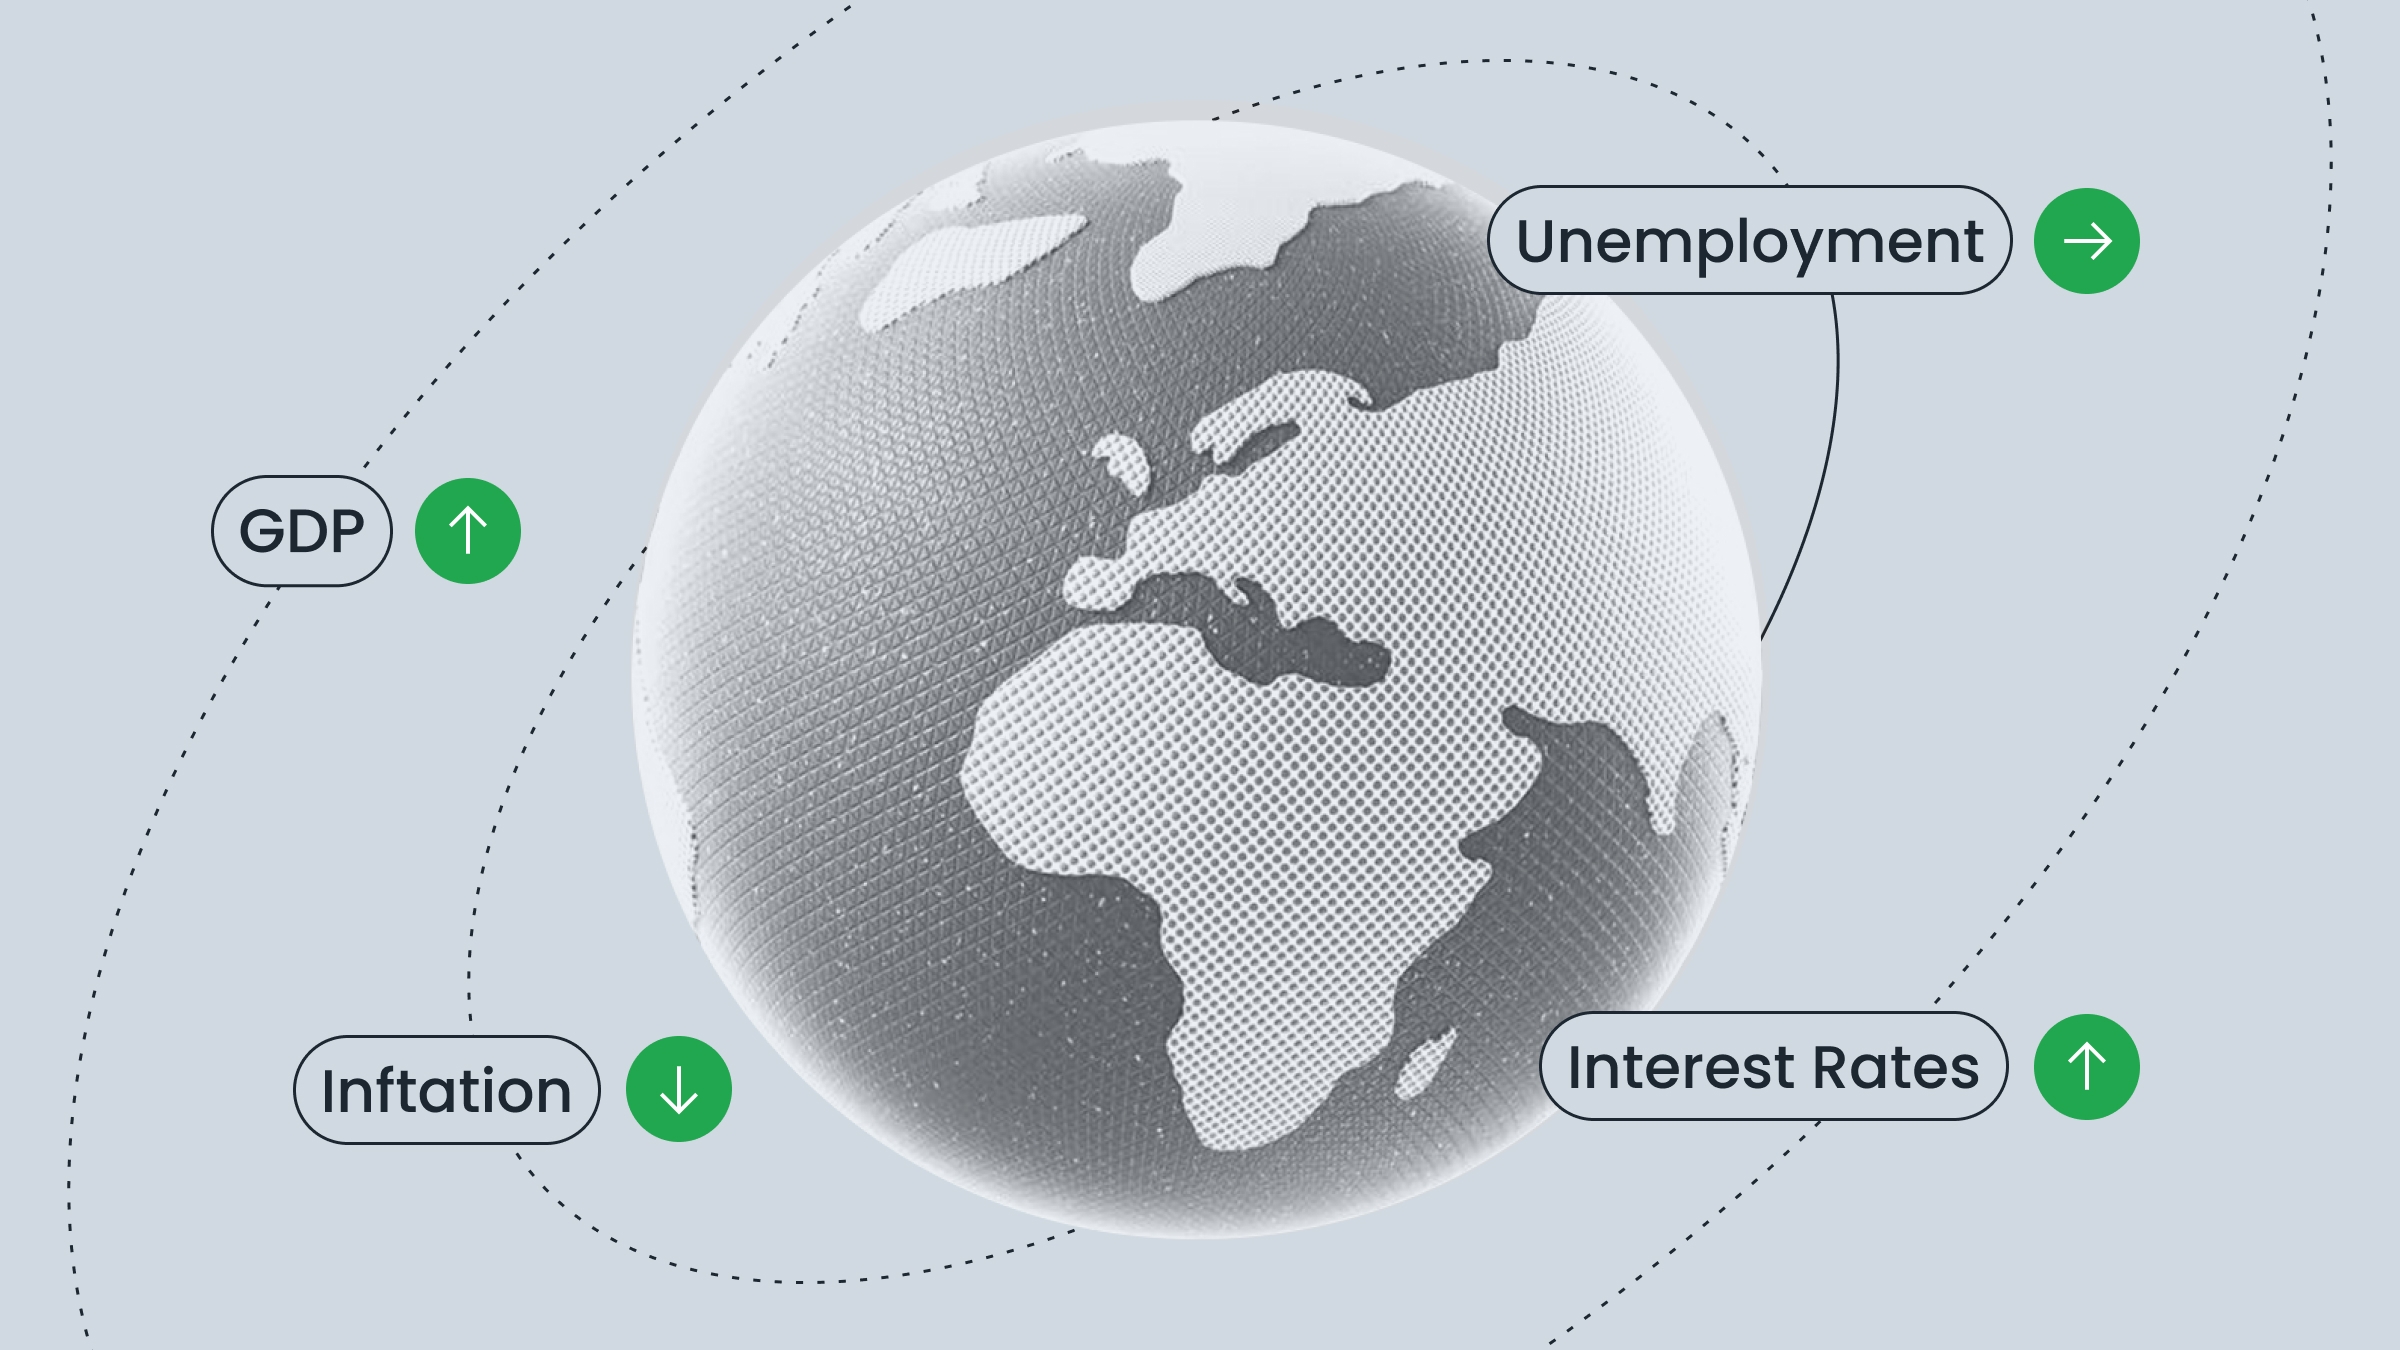
Economic indicators provide specific data on targeted areas of the economy. Investors can choose to focus on specific ones based on their investment strategies. Here are some examples of economic indicators:
1. Gross Domestic Product (GDP) is a lagging indicator that represents a country’s economic production and growth over a specific period. It’s considered the best indicator for measuring the size and health of the economy.
2. Interest rates are the percentage paid to owners of a savings account or charged to those who take out a loan. They are regulated by a country’s central bank, which raises them to curb inflation and lowers them to stimulate growth. If rates get too high for too long, they can trigger a recession, which is a significant decline in economic activity that lasts several months.
3. Currency strength is a popular lagging indicator that gives you an idea of the strength of a country’s economy by comparing its national currency to those of other countries. If a country’s currency is strong, it attracts more economy-boosting investments. It also has more buying power, allowing it to import for cheaper and sell abroad at a higher price. If the currency is weak, though, it can be cheaper for people to visit and attract tourism.
4. Stock markets are where shares of publicly traded companies are bought and sold. These are very speculative and do not necessarily reflect the true value of stocks, as some may be overbought or oversold, and bubbles may form. Stocks usually go up when positive earnings reports are released. This could indicate that companies are performing well and that the economy is thriving.
5. Unemployment and wage data are lagging indicators that focus on the number of jobs lost and created in the last month and how much workers are getting paid. Low unemployment and high wages are signs of economic growth. This data may already be outdated by the time it is released.
6. The Consumer Price Index (CPI) is another lagging indicator and one of the most commonly watched for inflation. It measures the changes in the cost of goods and services from month to month, and therefore the cost of living, after they have already occurred. When inflation gets too high, it can impair the economy’s performance since people need more money to get the same amount of goods. People’s savings dwindle, and their purchasing power is diminished.
7. The Producer Price Index (PPI) is a coincident and leading indicator for inflation because it shows the changes in the costs of producing goods (such as mining, manufacturing, agriculture, forestry, and fishing) before the price changes appear in stores. It’s also the first report released in the month, so it can give you a taste of what’s to come. Whereas the CPI measures prices for consumers, the PPI measures prices for industries.
8. The real estate market is a leading indicator since it tells us how many new housing project applications have been filed before actual construction starts at least six months down the road. Housing starts show us the number of projects that have officially begun construction. This shows demand for new houses and changes in property prices. A weak housing market can affect other areas of the economy through a loss of construction jobs, a reduction of homeowners’ wealth, and the potential for them to default on their loans.
Benefits of using economic indicators for trading
Economic indicators can serve a wide range of purposes depending on who is looking at them.
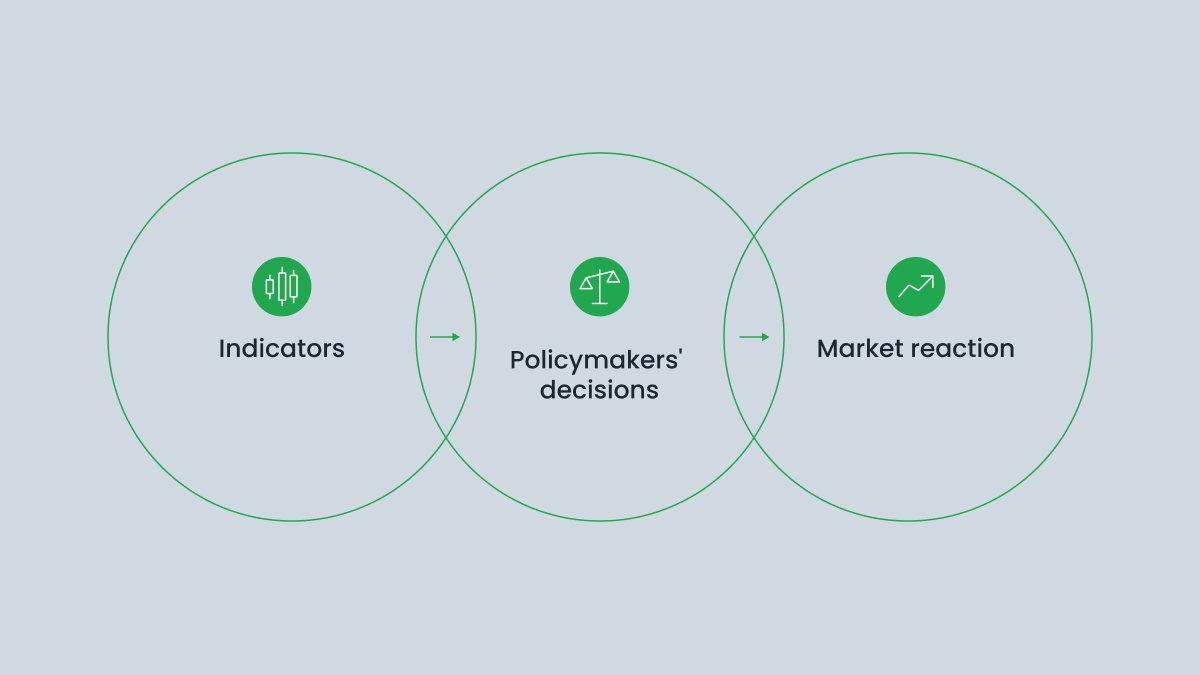
Governments and central banks will use them to elaborate political and fiscal policy, such as raising interest rates to cool the economy and bring down inflation. Sometimes, they disagree on the way forward.