
FBS turns 16
Unlock birthday rewards: from gadgets and dreams cars to VIP trips.Learn more
June 16, 2025
Strategy
Analyzing the Market Using The Advance/Decline Line
Trading indices can be a great chance to learn more about the stock market and see the influence of stocks on the index. This article is about an indicator created especially for trading indices - the Advance/Decline Line.
The Advance/Decline Line is a less popular technical indicator than the RSI, Stochastics, and MACD. These other indicators are momentum based - aimed at determining the strength or weakness of a stock - but the A/D line indicator shows how many buyers and sellers are participating in a stock market rally or decline. This is called market width.
While this article emphasizes the applications of the A/D indicator to the stock market, you can add the indicator to your FBS app or MetaTrader and use it for all kinds of assets.
What is the Advance/Decline Line?
The Advance/Decline Line (ADL) is a technical indicator that displays the difference between the number of stocks going up and down from day to day. This indicator is mostly used for trading stocks and indices. It shows a stock’s part in market rises or falls.
The most popular indices are capitalization-weighted ones, also known as market value-weighted. The weight of a particular stock is determined by its total market capitalization. In this kind of index, stocks with larger market capitalizations have a higher weight, and any changes in their stock prices will have a greater impact on the performance of the index. For example, in the S&P 500, Apple stock has the highest weight.
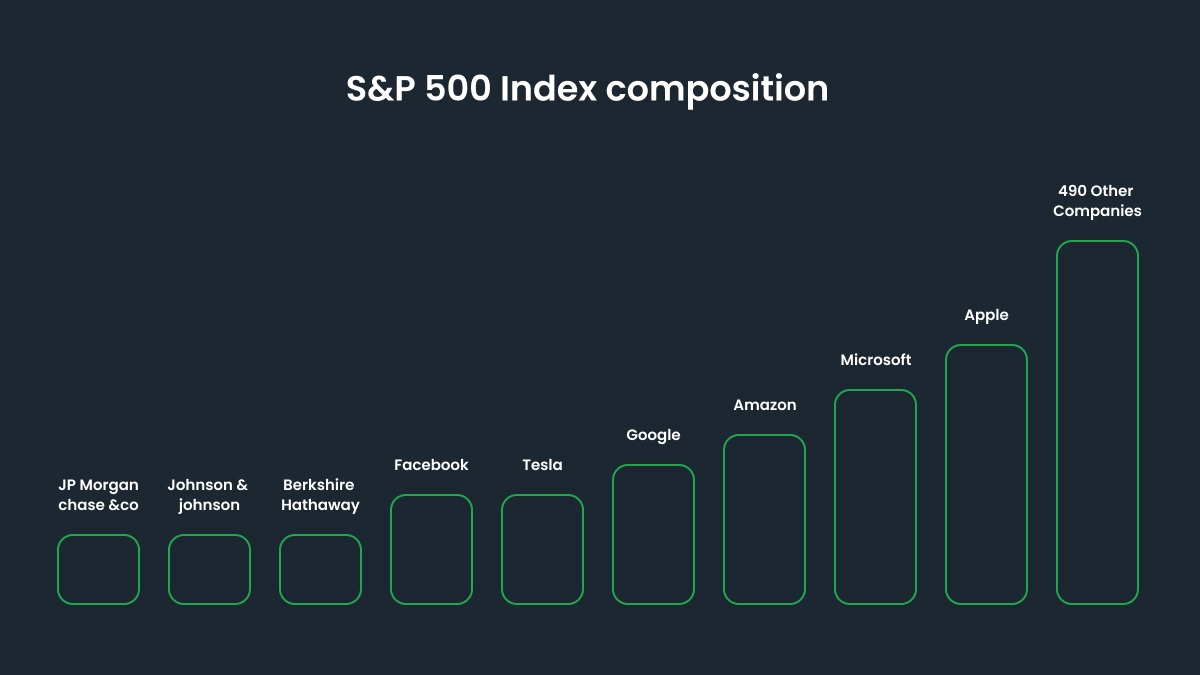
Due to a large number of capitalization-weighted indices, such as the S&P 500, DJIA, and NASDAQ Composite, stocks with higher market caps will disproportionately influence index performance. Thus, the ADL shows what share of the index’s stocks contribute to the overall direction of the market.
For example, if a capitalization-weighted stock index rises by 3%, it will be important for traders to know two things:
First, they must understand whether the increase in the index was due to an increase in majority stocks.
Second, they have to figure out whether the increase in the index was due to the exceptional performance of one company with a large weight in the index. The A/D Line can provide this information.
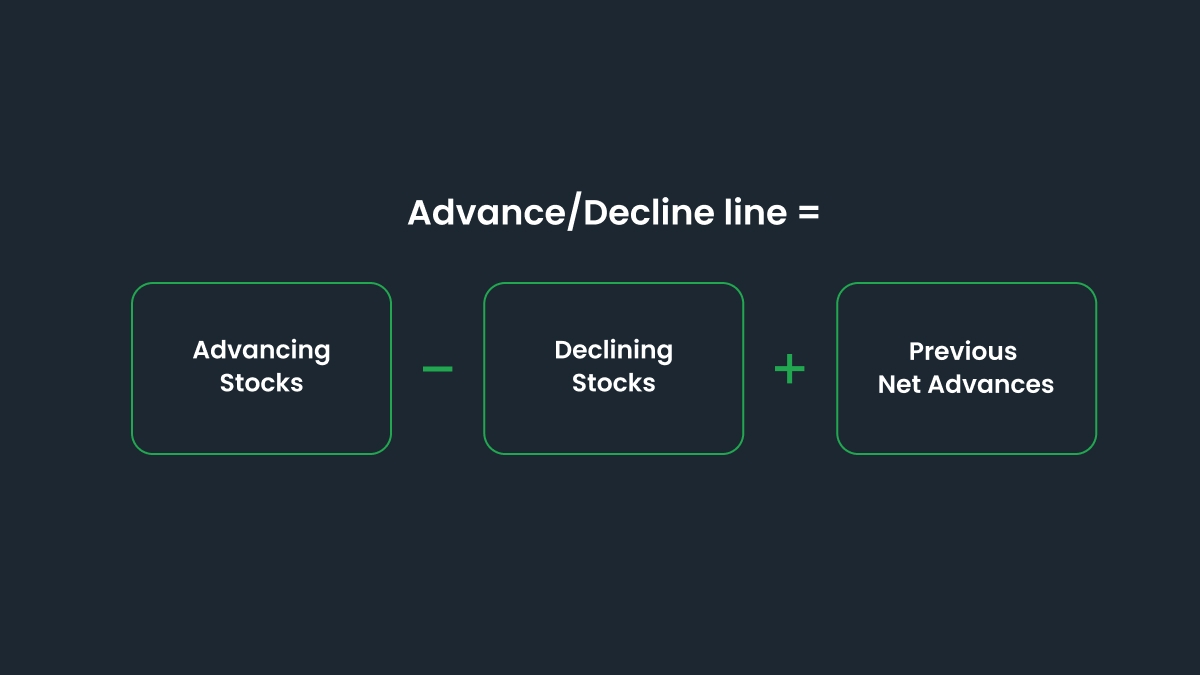
The formula for the Advance/Decline Line
The A/D line is very easy to calculate and understand. It has three components:
Advancing stocks - the total number of stocks in a market index, whose value has risen over the last day.
Declining stocks - the total number of stocks in a market index, whose price declined over the last day.
Previous net advances - the net sum of rising and falling stocks over the last day.
Advance/Decline Line indicator in the FBS app
Here is how to apply the indicator in the FBS app:
Open the FBS app and choose the trading instrument. Start by selecting the asset you want to analyze (e.g. gold, EURUSD, or Bitcoin).
Go to the chart view. Tap on the asset to open its detailed chart.
Tap on Indicators. You’ll find this option just below the chart on the left side.
Search for the Advance/Decline indicator. Type or scroll to find the AD indicator in the list.
Tap Apply. Once selected, the AD line will appear directly on your chart, ready to help you spot volume-based trends.
Don’t have an account yet? Here is a simple guide to opening your account with FBS: How to Start Trading Online with the FBS App
Advance/Decline In MetaTrader
The A/D Line indicator is not included in the list of standard indicators; you need to install it by yourself. To do that, follow these steps:
Download Advance/Decline Line for MT5 in .mq5 format. For MT4, you need .mq4.
Open MT4 or MT5 and go to File - Open Data Folder. Then, select MQL4/5 - Experts or Indicators and transfer the indicator file in MQL4/EX4 or MQL5/EX5 format to this folder.
Start or restart your MetaTrader 4/5.
Select chart and timeframe where you want to test your MT5 indicator.
Click Insert, then Indicators and you’ll find the Advance/Decline Line in the Custom Indicators section.
Click OK and the Advance/Decline Line becomes available on your chart.
Advance/Decline Line signals
There are two main signals that the A/D Line gives. Let’s look through them.
Trend strength
Traders can use it to confirm the strength of the trend. We have mentioned this before, but it bears repeating:
When the A/D Line moves up with the price action, it indicates a healthy uptrend. There’s wide participation of stocks in an uptrend, and the price movement is expected to continue upwards. When a line moving down is combined with the declining price action, it’s a sign of a healthy downtrend. Prices are expected to continue moving down.
Below we see an example of an S&P 500 price chart shown with an A/D Line that is used to confirm the health of an existing price trend.
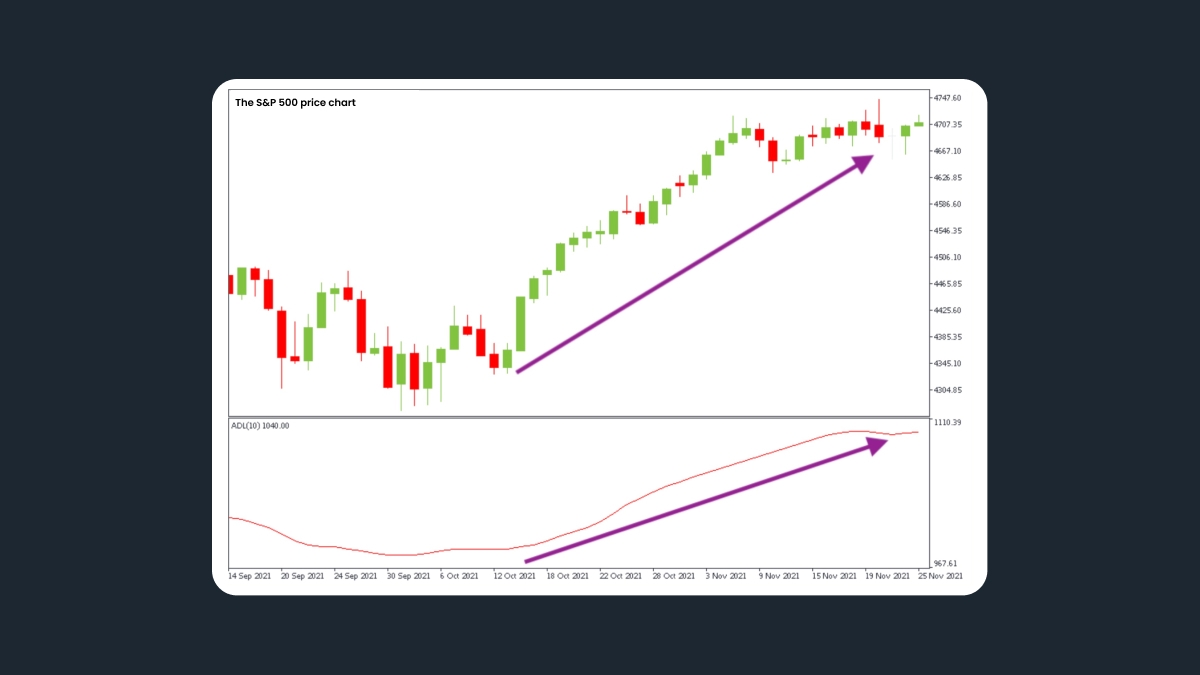
The price of the S&P 500 and The Advance/Decline Line move in the same uptrend direction. The A/D Line confirms the price action by rising. This indicates the broad participation of stocks in this uptrend and provides some confirmation of the price trend.
Potential reversal
The A/D Line can be used to spot potential pivot points. At the moment of a potential reversal in an existing uptrend, expect the price action to make higher highs and the A/D Line to make lower highs. This is called a bearish divergence between the price and the A/D Line.
On the other hand, we can identify a potential reversal in an existing downtrend by studying the price chart and looking for swing lows that are gradually lowering while the A/D Line is making higher lows. This is a bullish divergence between the price and the A/D Line.
Below is a Nasdaq price chart with the A/D Line used to identify a divergence between price and the A/D Line.
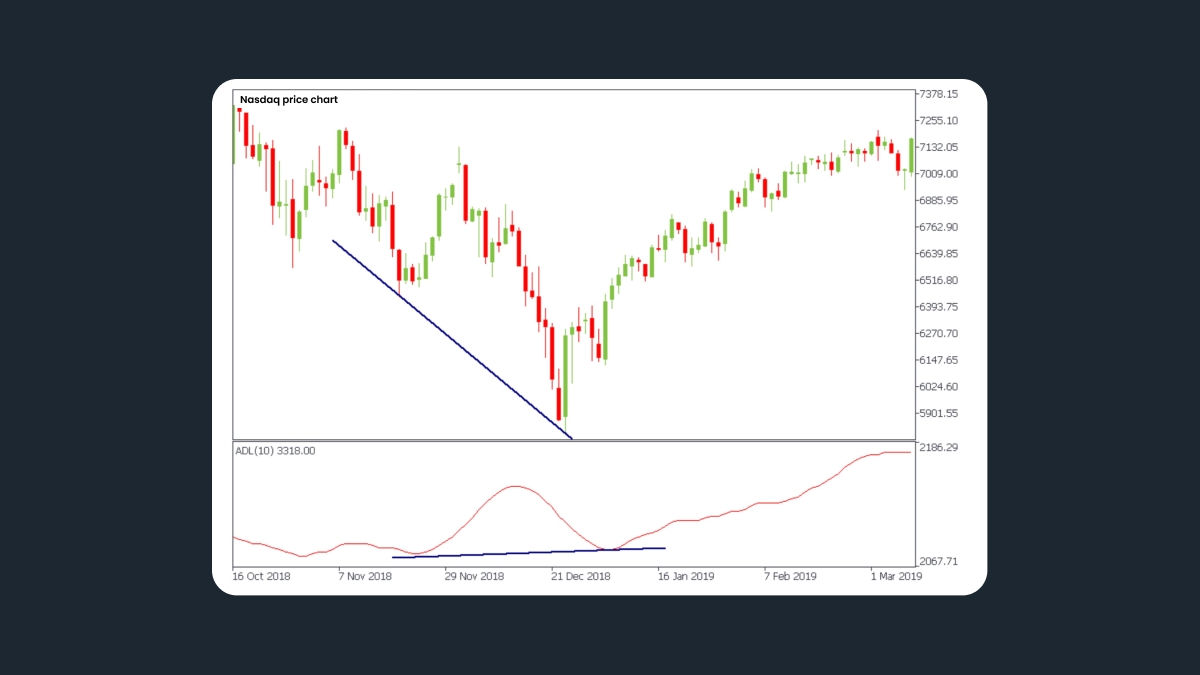
The Nasdaq price action created two major swing lows, with the second swing low lower than the first swing low. At the same time, the A/D Line created a pattern in which the second low is higher than the first low. This creates a bullish divergence between the price and the A/D Line.
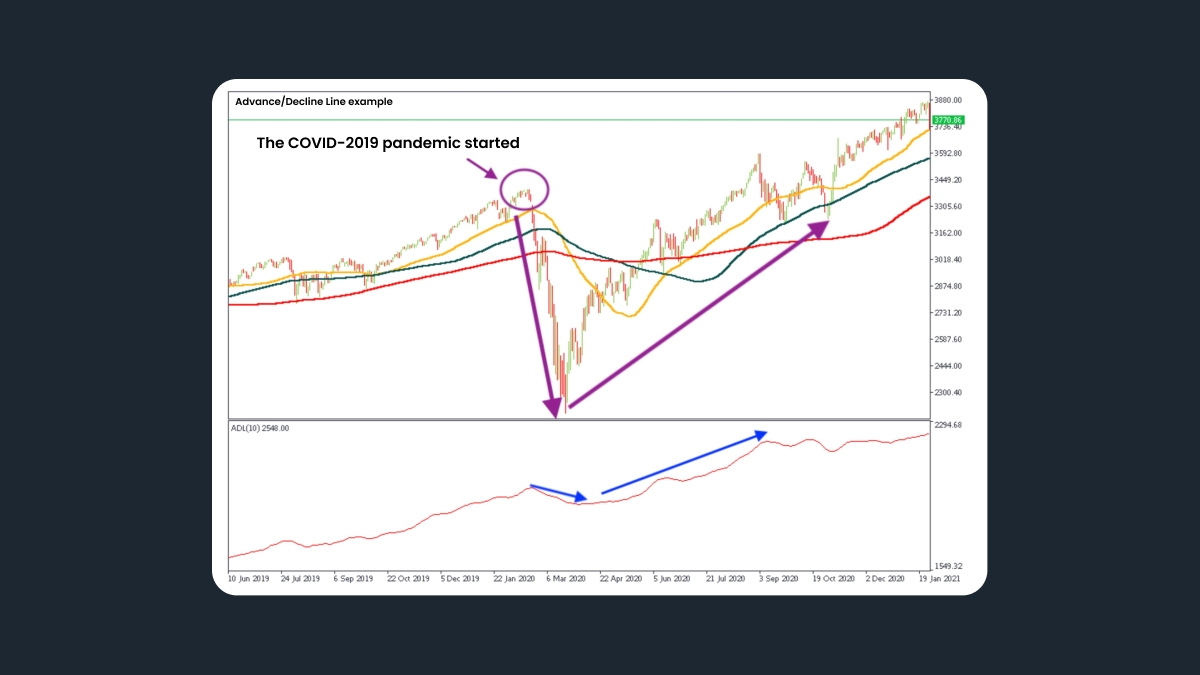
Advance/Decline Line example
The chart below shows an A/D Line for the S&P 500 Index. This chart shows the rate dropped sharply when the Covid pandemic was announced in 2020, as the number of falling stocks and their volume increased in the S&P 500 index.
Shortly after that, the indicator rose as the number of shares rising – their volume – increased.
Obstacles of the Advance/Decline Line
The A/D Line doesn’t always give accurate data for Nasdaq stocks. This is because the Nasdaq often lists small, speculative companies, many of which end up failing or delisting. When stocks are delisted from the exchange, they remain at their previously calculated A/D Line values. This affects future calculations that are added to the previous cumulative value. Because of this, the A/D Line will sometimes fall for extended periods of time, even when the Nasdaq index price is rising.
Another thing to be aware of is that some indices are weighted by market cap. The larger the company, the more influence it has on the movement of the index. The A/D Line gives equal weight to all stocks, which makes it a better indicator of medium-sized, small-cap, and mid-cap stocks, not fewer large-cap or mega-cap stocks.
Summary
The Advance/Decline Line is a great indicator that can give valuable insights into price action within a major market index. The most reliable trading signal that the A/D Line gives is the divergence signal. Traders should pay attention to bullish or bearish divergence signals between the price action and the A/D Line. These events often lead to a market reversal, which can be very profitable.
Open an FBS account
By registering, you accept FBS Customer Agreement conditions and FBS Privacy Policy and assume all risks inherent with trading operations on the world financial markets.