
Cara Trading dengan Pola Grafik Segitiga
Pola grafik segitiga (triangle) adalah pola konsolidasi yang melibatkan suatu harga aset yang bergerak dalam kisaran yang menyempit secara bertahap.
Diperbarui • 2022-05-18
Technical analysis is the base instrument for a trader. Although not all traders rely on technical indicators, we highly recommend combining different methods to get a higher profit.
So today we want to tell you how technical analysis appeared.
A “father” of the technical analysis is Charles Dow, who created the world famous Dow Jones Industrial Average Index together with Edward Jones. Moreover, he was a head editor in the Wall Street Journal where he was publishing his Technical Analysis from 1900 to 1902 as a series of articles. Later in 1932 Robert Rhea collected his works and published The Dow Theory.
Although technical analysis has developed, it is based on the Dow theory.
Let’s look at the basic tenets.
I. The price (average) discounts everything.
The main idea is that any factor that affects a price - economic, political, psychological - is already taken into consideration by a market and included in prices.
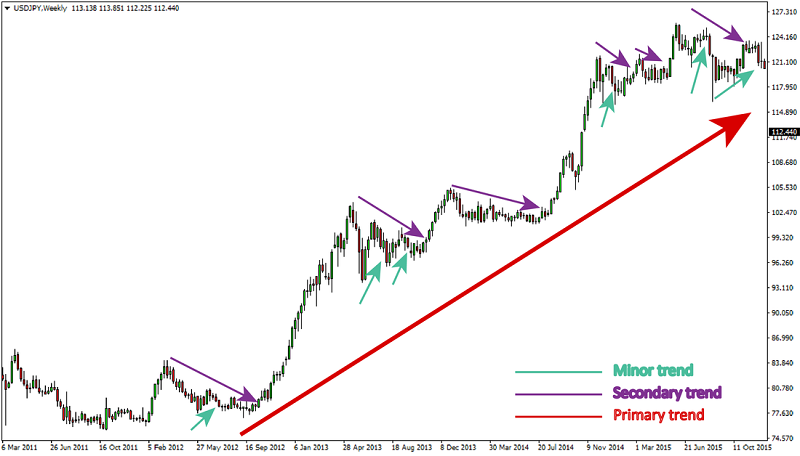
II. The market has three trends.
Firstly, it is worth to clarify what a “trend” is. Trend is the general direction of a market or a price. It can vary in length from short to intermediate, to long term.
III. The market trends have three phases.
They are:
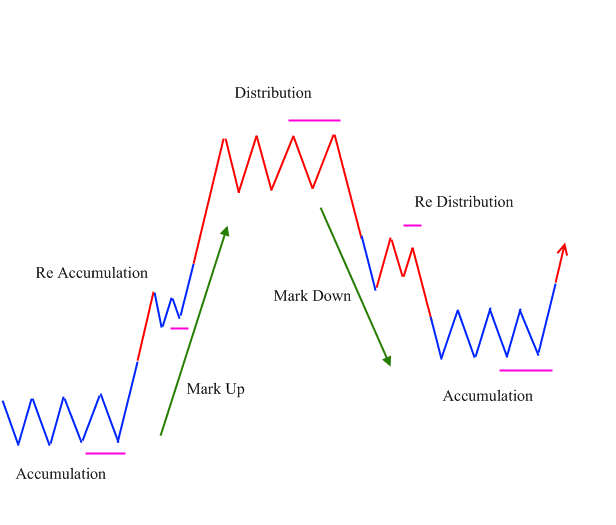
IV. Volume must confirm the trend.
Dow assumed that volume should increase in the direction of the main trend. So while upward trend, the volume should grow with an increase in price. Vice versa, in major downward trend, volume should expand together with falling prices.
V. A trend is assumed to be in effect until it gives a definite signal of reversal.
Dow believed that trend remains until the specific signal of reversal appears.
The logic is: an upward trend is created when every next pick and dip are higher than previous ones. A downtrend, on the contrary, has decreasing peaks and dips. So an obvious signal for the upcoming reversal is the formation of a lower minimum within the upward movement. In the case of the downward trend, the situation is reversed.
There are other reversal signals such as resistance/support, price patterns, trend lines and moving averages.
Making a conclusion, we can say that although nowadays technical analysis and markets have developed, the Dow theory had a huge influence on them. Also, the idea of emotions in the marketplace still remains a characteristic of market trends. Furthermore, its aspects were incorporated into other theories, such as Elliott Wave theory. So we can say that the Dow theory played an enormous role in the trading theory.
Pola grafik segitiga (triangle) adalah pola konsolidasi yang melibatkan suatu harga aset yang bergerak dalam kisaran yang menyempit secara bertahap.

Terkadang grafik atau pola candlestick dapat memberikan sinyal masuk yang bagus ketika terletak pada level tertentu. Pin bar adalah salah satu pola candlestick yang cukup andal dan terkenal, dan ketika trader melihatnya pada grafik, harga kemungkinan besar akan segera berubah arah.

Ada banyak strategi bagus yang membutuhkan pengetahuan tentang pola candlestick dan osilator. Namun, tidak ada yang menguntungkan. Ketika Anda mulai trading dengan strategi tersebut, Anda mungkin menghadapi situasi di mana strategi tidak bergerak sesuai ekspektasi.
FBS dan karier Forex diperuntukkan hanya kepada klien yang berusia 18 tahun ke atas. Untuk memulai trading, Anda harus memiliki akun di broker dan pengetahuan yang cukup, minimal tentang karakteristik aset di pasar keuangan. Mulailah dengan mempelajari dasar-dasarnya dengan materi edukasi gratis dari kami dan buka akun di FBS. Anda bisa mengamati lingkungan trading terlebih dahulu dengan dana virtual di akun Demo. Apabila sudah siap, Anda bisa memasuki pasar yang sesungguhnya dan trading dengan sukses.
Klik tombol “Buka akun” di situs web kami dan buka Area Trader. Sebelum Anda dapat memulai trading, lakukan verifikasi profil. Konfirmasikan email dan nomor telepon agar identitas Anda terverifikasi. Prosedur ini menjamin keamanan dana dan identitas Anda. Setelah menyelesaikan semua pemeriksaan, buka platform trading yang Anda inginkan, dan mulailah trading.
Prosedurnya sangat mudah. Buka halaman Penarikan di situs web atau tab Dana di Area Personal FBS untuk mengakses penarikan dana. Anda bisa menarik keuntungan yang diperoleh melalui sistem pembayaran yang sama dengan yang Anda gunakan untuk deposit. Jika Anda melakukan deposit melalui beberapa metode, tarik keuntungan Anda melalui metode yang sama dengan rasio yang sesuai dengan jumlah yang didepositkan.
FBS menyimpan catatan data Anda untuk menjalankan website ini. Dengan menekan tombol "Setuju", Anda menyetujui kebijakan Privasi kami.
Permintaan Anda diterima.
Manajer kami akan menghubungi Anda
Permintaan panggilan balik berikutnya untuk nomor telepon ini
akan tersedia setelah
Jika Anda memiliki masalah mendesak, silakan hubungi kami melalui
Live chat
Internal error. Silahkan coba lagi
Jangan buang waktu Anda – tetap awasi dampak NFP terhadap dolar dan raup profitnya!
|


